April 9, 2026

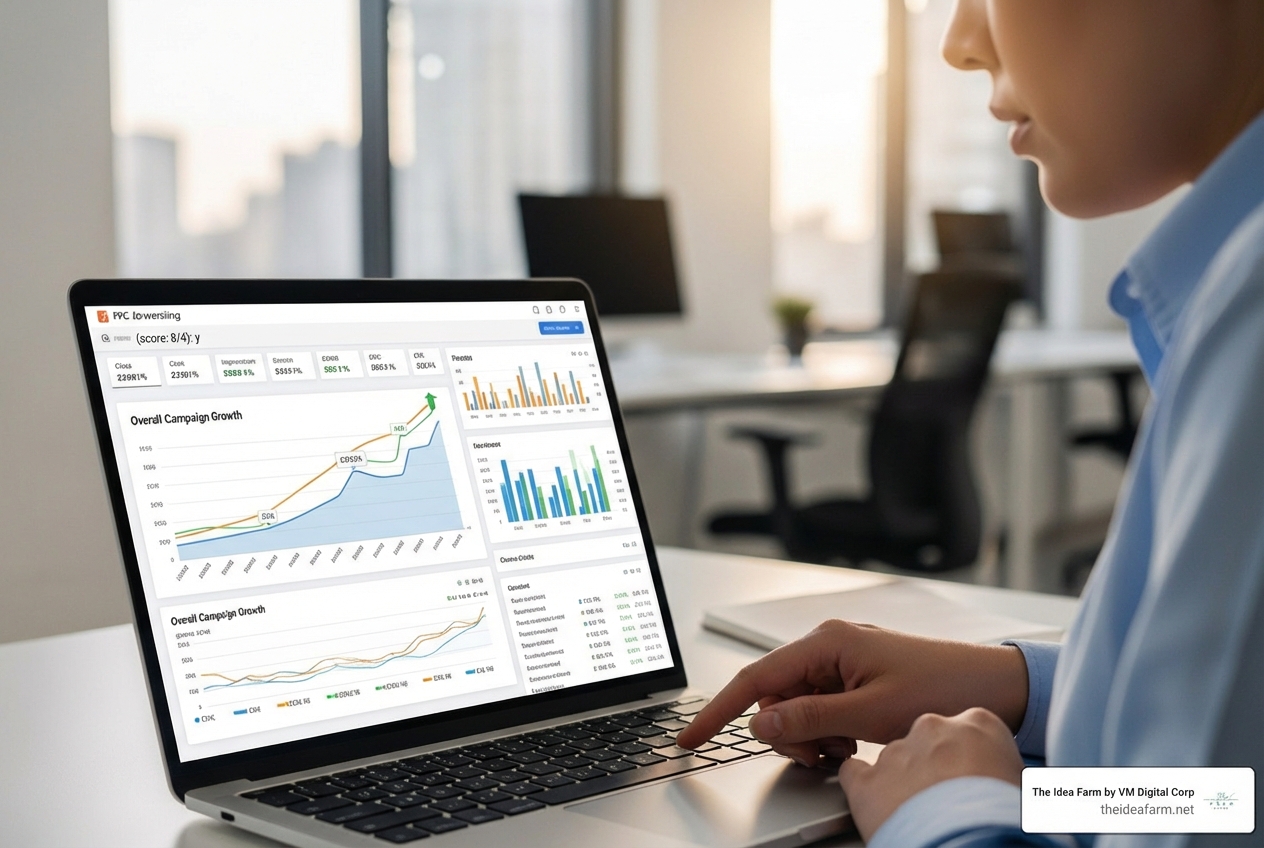
A dashboard for SaaS is a screen that shows your business numbers in real time. It helps you know how your business is doing.
Quick answer: What is a SaaS dashboard?
| What It Is | What It Does | Who Uses It |
|---|---|---|
| A data hub | Tracks money and growth in one place | Bosses and teams |
| A live report | Replaces old files with live updates | Any team that wants to grow |
| A tool for choices | Turns data into clear signs | Small and big teams |
Most SaaS owners know their product. But without a clear view of the numbers, they have to guess. You spend money but do not know if it works. You miss signs that customers are leaving.
A good SaaS dashboard helps. It puts your data in one place. It makes reports for you. It shows the whole team what is working. This leads to fast choices and a better business.
I am Jose Escalera. I am the CEO of The Idea Farm by VM Digital. I help businesses grow. I have seen how a dashboard for saas helps you plan for the future. In this guide, I will show you how to build one that works.

Handy dashboard for saas terms:
When you start, you might just check your bank once a week. But as you grow, that is not enough. Many owners spend too much time making reports by hand.
Spreadsheets are hard. They get old fast. They often have mistakes. One wrong number can make you worry for no reason.
A modern dashboard for saas is a hub for your data. It links to your sales and tools. It updates on its own. When a customer leaves, you see it right away. This helps you stay healthy. It moves your team from guessing to knowing.
At The Idea Farm, we act as a fractional CMO for fast-growing companies. We see that teams feel better when they see their numbers. Your team will spend less time looking for data. They will spend more time using it. You will stop arguing about files and start talking about how to grow.
Not all data is the same. Do not just look at 'vanity metrics.' These are things like page views that do not show if the business is healthy. To build a good dashboard for saas, focus on what makes you money.
Here are the big ones:

Knowing how these numbers work together is key. For example, the LTV to CAC ratio shows if your ads work. A 3 to 1 ratio is very good. If it is 1 to 1, you spend too much.
Another rule is the Rule of 40. This says your growth plus your profit should be 40% or more. It is a quick way to see if you are doing well.
SaaS money is tricky. You have to track new sales and people who leave. A revenue dashboard helps you see your real growth.
Tracking cash is also important. Revenue is what you earn, but cash is what you have in the bank. Fast-growing companies need to watch this. You pay to get customers today, but you do not get that money back for a few months.
To start, you can use a SaaS metrics dashboard template to see how this looks.
One dashboard does not work for everyone. A boss needs a big picture. A support manager needs to see which customers might leave. We suggest making different views for different teams.
We often suggest growth strategy sessions to help teams pick their numbers. This keeps everyone focused on their own job.
Your growth team needs special tools. A marketing dashboard should show where leads come from. It shows which ads make money.
A sales pipeline dashboard example might show:
On the marketing side, a Google Ads analytics dashboard example helps you see your ads. This stops you from wasting money on words that do not bring in sales.
The biggest danger is having too much on the screen. If you have 50 charts, no one will look. You want a clean look that shows the most important numbers.
Here are the rules we use at The Idea Farm:
The Rule of 40 is a way to see if a business is healthy. You add your growth rate to your profit. If the total is 40 or more, you are doing great. It helps you grow without spending too much money.
Dashboards are better for four reasons. They are Automatic (no typing), Live (no waiting), Shared (everyone sees the same thing), and Visual (charts are easier to read). Spreadsheets are slow. Dashboards are fast.
A dashboard works if it helps you make choices. You can tell it is working if:
Building a dashboard for saas is about more than just software. It is about having a plan. Data is just noise without a plan. At The Idea Farm, we believe every business needs a data system to grow.
We help you build the "brain" of your business. This system tells you where to spend money to grow. Whether you need a growth dashboard or a new marketing plan, the goal is the same. We want you to have clear data and steady growth.
Stop guessing and start growing. The numbers are there. You just need the right way to see them.